Managing a Test Suite
Move beyond individual tests to manage a full test suite. Learn to organize tests, run tests in parallel, filter by labels, and measure our code coverage
The last few lessons have equipped us with a powerful set of tools for writing individual tests. We can use GoogleTest for expressive assertions, mock dependencies to isolate our code, and create parameterized tests to cover a wide range of inputs.
This lesson takes the next logical step. Instead of focusing on how to write a single test, we'll learn how to manage, scale, and analyze an entire test suite. As a project grows from a handful of tests to hundreds or thousands, new challenges emerge:
- How do you run just a specific subset of tests to debug a feature?
- How do you speed up a test suite that's taking too long to run?
- How do you know what parts of your code are not being tested?
We'll answer these questions by exploring advanced CTest features for organizing and running tests, and by introducing the concept of code coverage analysis to measure the effectiveness of our test suite.
The Test Suite Structure
For this lesson, we'll use the project structure we developed in the , where we have separate test executables for our application logic (GreeterAppTests) and our library (GreeterLibTests):
Greeter/
├─ app/
├─ greeter/
└─ tests/
├─ app/
│ ├─ CMakeLists.txt
│ └─ test_app.cpp
├─ greeter/
│ ├─ CMakeLists.txt
│ └─ test_greeter.cpp
└─ CMakeLists.txtThe root CMakeLists.txt enables testing and adds the test subdirectories, while each component's test directory builds a test executable and uses gtest_discover_tests() to register its tests.
Advanced CTest Features
As our test suite grows, running ctest by itself becomes inefficient. We need ways to select, organize, and accelerate our tests.
Filtering Tests
Sometimes you're working on a specific feature and only want to run the tests related to it. CTest provides two primary flags for this, which can be combined.
-R <regex>or--tests-regex <regex>: Run only the tests whose names match the given regular expression.-E <regex>or--exclude-regex <regex>: Exclude tests whose names match the regex.
To run only the tests for our log file creation (which all have AppLogTest in their name as they use that fixture class), we could use the following command from our build directory:
ctest -R AppLogTest1/1 Test #4: AppLogTest.LogsStartupMessageToFile ... Passed
100% tests passed, 0 tests failed out of 1To run all tests except those, we'd use -E:
ctest -E AppLogTest...
100% tests passed, 0 tests failed out of 3This is useful, but relying on naming conventions can be brittle. A better way to group tests is with labels.
Grouping with Labels
Labels are tags you can attach to a group of tests. The main way we label tests managed by gtest is to pass additional arguments to the gtest_discover_test() command.
In the following example, we attach the "library" label to all tests found for our GreeterLibTests target:
tests/greeter/CMakeLists.txt
cmake_minimum_required(VERSION 3.23)
find_package(GTest REQUIRED)
add_executable(GreeterLibTests test_greeter.cpp)
target_link_libraries(GreeterLibTests PRIVATE
GreeterLib
GTest::gtest
GTest::gmock
GTest::gmock_main
)
gtest_discover_tests(GreeterLibTests
# Label all discovered tests as library tests
PROPERTIES LABELS "library"
)And similarly, for application tests:
tests/app/CMakeLists.txt
cmake_minimum_required(VERSION 3.23)
find_package(GTest REQUIRED)
add_executable(GreeterAppTests test_app.cpp)
target_link_libraries(GreeterAppTests PRIVATE
GreeterAppLogic
GTest::gtest_main
)
gtest_discover_tests(GreeterAppTests
# Label all discovered tests as application tests
PROPERTIES LABELS "application"
)Now, after re-building, we can use the -L <label> flag to run tests by group. To run all application-level tests, we'd use this command from our build directory:
ctest -L application...
100% tests passed, 0 tests failed out of 1You can even combine labels with regexes for more complex filtering.
Parallel Execution
As the number of test executables grows, the total run time can become a bottleneck. CTest can run your test programs in parallel to speed things up. The -j <N> flag tells CTest to use up to N parallel jobs.
This command will run up to 8 test executables simultaneously:
ctest -j8...
100% tests passed, 0 tests failed out of 4
Label Time Summary:
application = 0.02 sec*proc (1 test)
library = 0.03 sec*proc (3 tests)
Total Test time (real) = 0.03 secEven though our application tests took 0.02 seconds and our library tests took 0.03 seconds, they were run concurrently, so the entire suite completed in 0.03 seconds.
Debugging Failures
When a test fails, ctest gives you some helpful options.
--output-on-failure: We've seen this before. It prints the stdout/stderr of any failing test. This is essential for debugging.--rerun-failed: This is a huge time-saver. After a test run where some tests failed, this command will re-run only the tests that previously failed, ignoring all the ones that passed. This is useful if we think we've fixed the failing tests, and want to get a quick verification.
Test Presets
As these command lines get longer, it's a good idea to encapsulate them in presets. We can create presets for running specific test groups and for debugging.
Below, we update our default test preset to use 8 parallel jobs. We also add app-tests and lib-tests presets that inherits from default to apply filtering based on our labels:
CMakePresets.json
{
"version": 3,
"configurePresets": [{
"name": "default",
"hidden": true,
"binaryDir": "${sourceDir}/build",
"toolchainFile":
"$env{VCPKG_ROOT}/scripts/buildsystems/vcpkg.cmake"
}],
"buildPresets": [{
"name": "default",
"configurePreset": "default"
}],
"testPresets": [{
"name": "default",
"configurePreset": "default",
"output": { "outputOnFailure": true },
"execution": { "jobs": 8 }
}, {
"name": "app-tests",
"inherits": "default",
"filter": { "include": { "label": "application" } }
}, {
"name": "lib-tests",
"inherits": "default",
"filter": { "include": { "label": "library" } }
}]
}Now, we can easily run a subset of our tests from our project root:
ctest --preset app-tests...
100% tests passed, 0 tests failed out of 1Code Coverage Analysis
Our tests confirm that the code we've written works as expected. But they don't tell us what we've missed. Code coverage is a metric that answers the question: "which parts of my production code were executed by my test suite?"
How it Works
- Instrumentation: You compile your code with special compiler flags that add "instrumentation". This extra code keeps track of which lines are executed and how many times.
- Execution: You run your test suite. As the tests run, the instrumentation writes raw coverage data to files on disk.
- Reporting: You use a separate tool to read these raw data files and generate a human-readable report (usually HTML) that visualizes the coverage.
Step 1: Setting Up CMake for Coverage
We need to add the instrumentation flags. For GCC and Clang, the flags are --coverage.
Since we only want this for a special coverage build, we'll create a new Coverage build type and use a generator expression to apply the flags.
We can implement on a target-by-target basis with commands like target_compile_options() and target_link_options() that we covered previously. Or, alternatively, we could implement it globally using add_compile_options() and add_link_options():
CMakeLists.txt
cmake_minimum_required(VERSION 3.23)
project(Greeter)
# Add coverage flags for GCC/Clang in the "Coverage" build type
set(COVERAGE_CONDITION
"$<AND:$<CONFIG:Coverage>,$<CXX_COMPILER_ID:GNU,Clang>>"
)
set(COVERAGE_FLAGS "$<${COVERAGE_CONDITION}:--coverage>")
add_compile_options(${COVERAGE_FLAGS})
add_link_options(${COVERAGE_FLAGS})
add_subdirectory(app)
add_subdirectory(greeter)
enable_testing()
add_subdirectory(tests)And we'll add corresponding presets to our CMakePresets.json:
CMakePresets.json
{
"version": 3,
"configurePresets": [
// ...
{
"name": "coverage",
"displayName": "Coverage Build",
"inherits": "default",
"cacheVariables": { "CMAKE_BUILD_TYPE": "Coverage" }
}
],
"buildPresets": [
// ...
{
"name": "coverage",
"configurePreset": "coverage"
}
],
"testPresets": [
// ...
{
"name": "coverage",
"inherits": "default",
"configurePreset": "coverage"
}
]
}Step 2: Generating Coverage Data
Now, we follow the usual three step process from our project root:
cmake --preset=coveragecmake --build --preset=coveragectest --preset=coverageAfter running ctest, our build directory will be populated with .gcno and .gcda files containing the raw coverage data. On Unix-like systems, we can confirm our coverage data is being generated using a command like this:
find build/ -name "*.gcda" -o -name "*.gcno"build/app/CMakeFiles/GreeterApp.dir/src/main.cpp.gcno
build/app/CMakeFiles/GreeterAppLogic.dir/src/run.cpp.gcda
build/app/CMakeFiles/GreeterAppLogic.dir/src/run.cpp.gcno
...We can get similar output using the dir command on PowerShell:
dir build -Recurse -Include "*.gcda", "*.gcno"Using gcovr
To turn this raw data into a useful report, we need a tool. There are several options here, but a Python-based tool called gcovr is quite common.
gcovr is only available as a Python package, so we must have Python installed on our system. Then, we can install it using pip:
pip install gcovrThen, from our root directory, we can generate the report:
gcovr -r . \
--filter 'greeter/' \
--filter 'app/' \
--html 'build/coverage.html'r .: Sets the root of your source tree to the current directory--filter: Sets what paths should be included in the report-html: Specifies the HTML output file
If we open our /build/coverage.html report in a web browser, we'll how much of our code the tests are covering:
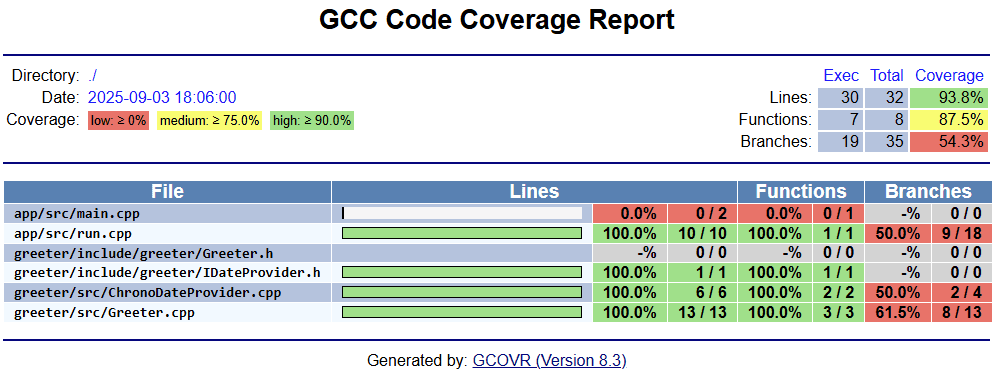
In our case, the tests are hitting every line of code aside from our main.cpp, which only includes the main() entry point after our recent updates.
However, it's important to note that just because a line of code is being executed in the process of running a test, that doesn't necessarily mean that the code is being tested in any meaningful way.
Coverage reports just give us a relatively simple way to discover which parts of our code definitely aren't being tested, because they're not even being executed by our suite.
Branch Coverage
Whilst our tests execute every line of our library code, the coverage report will show that they don't execute every branch.
Even very simple statements can include hidden branching behavior, such as this line in our library:
day_str = "Happy Monday!";This is because the std::string's = operator can throw an exception if, for example, memory-related limitations prevent the assignment. This would result in a std::bad_alloc or std::length_error exception.
The branch coverage section of our report tells us that our tests did not create that scenario. In this case, the code in our library also isn't considering this possibility.
Our production could be updated with to handle exceptions. Our test code could then create these exceptions by using the we covered previously.
Automating Report Generation
We can use all the techniques we covered earlier, such as or to automate processes such as generating coverage reports.
For example, the following code creates a custom coverage target that lets us invoke gcovr without needing to provide the arguments:
CMakeLists.txt
cmake_minimum_required(VERSION 3.23)
project(Greeter)
set(COVERAGE_CONDITION
"$<AND:$<CONFIG:Coverage>,$<CXX_COMPILER_ID:GNU,Clang>>"
)
set(COVERAGE_FLAGS "$<${COVERAGE_CONDITION}:--coverage>")
add_compile_options(${COVERAGE_FLAGS})
add_link_options(${COVERAGE_FLAGS})
find_program(GCOVR_EXE gcovr)
if(GCOVR_EXE)
add_custom_target(coverage
COMMAND ${GCOVR_EXE}
-r "${CMAKE_SOURCE_DIR}"
--filter "${CMAKE_SOURCE_DIR}/greeter/"
--filter "${CMAKE_SOURCE_DIR}/app/"
--html "coverage.html"
COMMENT "Generating code coverage report..."
)
message(STATUS "Added 'coverage' target")
endif()
add_subdirectory(app)
add_subdirectory(greeter)
enable_testing()
add_subdirectory(tests)Now, after running our tests in a coverage build, we can generate the report with a simple command from the build/ directory:
cmake --build . --target coverageRemember, we can (and should) keep our root CMakeLists.txt file as clean as possible by moving capabilities out to when things get too noisy:
Files
Summary
This lesson improved our testing from writing individual checks to managing a complete test suite.
- Suite Management: We used CTest's filtering (
-R,-E) and labeling (-L) capabilities for fine-grained control, and ran tests in parallel (-j) for speed. Presets allow us to encapsulate these complex commands into simple, named workflows. - Code Coverage: We learned how to instrument our code with
--coverageflags and usegcovrto generate reports that show where the gaps in our testing are. - Automation: By creating custom targets for tasks like coverage analysis, we can integrate these workflows into our build process, and automate them.
Using AddressSanitizer (ASan)
Learn to find memory bugs at runtime by integrating AddressSanitizer (ASan) into a CMake project