Introduction to Debugging
Creating a tiny program using numbers and booleans, then adding some breakpoints so we can step through our code in a debugger.
Inevitably, our program will run, but it will not work as we intended. Some boolean we thought would be true will be false, or some number will be different from what we expected it to be.
When this happens, and we don't understand why, our first task will be to try to get some observability on what is happening at run time.
We already know one way to get observability on our program as it runs - we can scatter statements that write to cout throughout our code to see the state of variables through time.
But that can take a lot of effort, particularly as our program gets larger. There is a more efficient way: using a debugger.
What is a Debugger?
A debugger is a tool used to inspect and modify the state of a running program.
It allows us to pause execution (often at specific points known as breakpoints), step through code, inspect variables, and even change their values on the fly.
Think of it as a magnifying glass that lets us zoom in on our code while it's running, providing valuable insights into its behavior.
Most IDEs have debuggers built-in, and in this lesson we'll be using screenshots from Visual Studio, but all debuggers tend to work in very similar ways. Their features include:
- Breakpoints: Set points where the program's execution will pause, allowing us to examine the current state.
- Step Execution: Move through the code line by line or breakpoint by breakpoint to observe our program state changes through time.
- Variable Inspection: View and modify the values of variables at runtime.
- Conditional Debugging: Set conditions under which the debugger will pause the program, useful for tracking down specific bugs.
Right now, our programs are very simple. However, getting comfortable with a debugger not only helps us find bugs - it's also a great learning tool.
It helps us quickly understand what our program is doing, so it's helpful to get into the habit early. Debugging a simple program is a good first step, so let's get started by creating some breakpoints.
Creating Breakpoints
Let's create a really simple program to see how a debugger can help us. There are no new concepts here - we're just creating and updating some variables. These are concepts we've already seen:
#include <iostream>
using namespace std;
int Health { 100 };
bool isDead { false };
int main()
{
Health -= 10;
isDead = Health <= 0;
Health -= 200;
isDead = Health <= 0;
}Debugging involves the introduction of "breakpoints" to our code. The debugger will run our program until it reaches a breakpoint, at which point it will pause, and allow us to examine the state of our running application at that specific time.
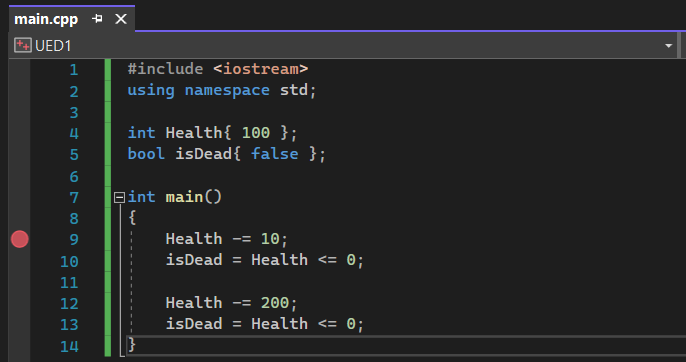
In most editors, we set a breakpoint by clicking an area to the left of the line of code where we want execution to pause. This should create some visual indicator to show where our breakpoint is.
In Visual Studio and many other editors, it appears as a red circle, as shown to the left of line 9 below.
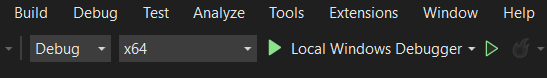
With our breakpoint set, we can then tell our editor to start the debugger. In Visual Studio, this is the large "Local Windows Debugger" button on our top menu.
Starting the Debugger
When our debugger runs, it should pause at the breakpoint we earlier set. The user interface of our IDE will also often change when we start debugging our program.
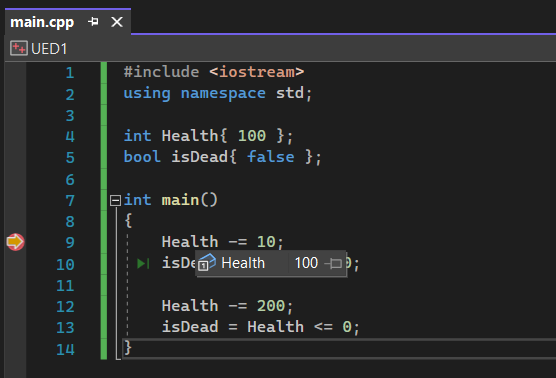
In Visual Studio, for example, we can now hover our pointer over any variable name to see its current value.
In the below screenshot, Health still has its initial value of 100. The line of code our debugger has paused at will reduce Health by 10, but that line hasn't run yet.
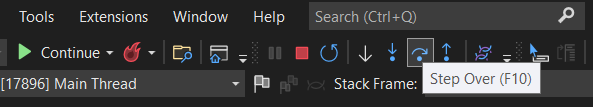
To control the execution of our program when debugging, we should see some new UI elements. We'll discuss these more as we cover more advanced topics, but for now, the most important commands are Step Over and Continue
In Visual Studio, these appear on our top toolbar and are also accessible from the "Debug" menu.
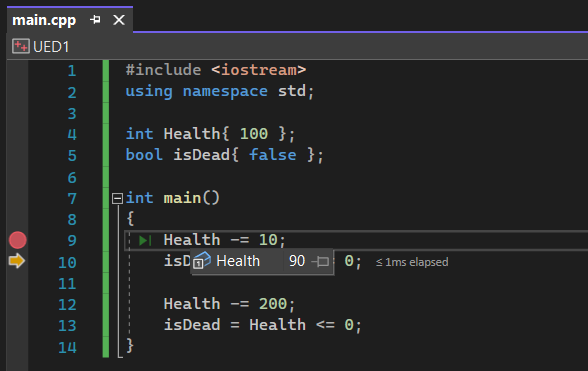
Executing the Next Line
Step Over will cause the debugger to execute the highlighted line of code. In our situation, by pressing Step Over, we will execute line 9, and pause before line 10.
Executing line 9 will decrease Health by 10 so, as expected, Health now has a value of 90 after pressing Step Over once.
Executing until the next Breakpoint
Continue will instruct the debugger to continue executing our program until it reaches the next breakpoint. If we have no further breakpoints, it will continue to completion.
Debuggers generally will not let us move backward. However, we can just restart from scratch if we advance too far.
Summary
In this lesson, we've taken a significant step in understanding the essential tools for C++ programming, specifically focusing on the use of a debugger. Here's a quick recap of what we covered:
- Introduction to Debuggers: Learned what a debugger is and its role in programming.
- Breakpoints: Setting specific points in the code to pause execution.
- Variable Inspection: Examining variable values during runtime.
- Step Execution: Navigating through code line-by-line or breakpoint-by-breakpoint to observe behavior.
Creating and Calling Functions
An introduction to functions - reusable blocks of code that we can use to break our application into smaller pieces.