The Call Stack and Debugging Functions
An introduction to how our function calls create a call stack, and how we can navigate it in a debugger.
In this session, we'll explore how function calls in C++ create what's known as a "call stack" and how this knowledge is vital in navigating the debugging process.
We start with a simple program to illustrate these concepts, making them easy to grasp. You'll learn about the call stack, a core component of program execution, and how to visualize it as a series of stacked blocks, each representing a function call.
Then, we explore the practical aspect of debugging. You'll get hands-on experience with tools like Step Over, Step Into, and Step Out. Understanding these tools is key to managing the complexity of code, especially when dealing with multiple function calls.
By the end of this lesson, you'll have a solid foundation in understanding the call stack and how to navigate it using a debugger. So, let's get started!
An Example Program
Let's create the following simple program to introduce the concept of the call stack.
#include <iostream>
using namespace std;
int Health{150};
void TakeDamage(){
cout << " - TakeDamage function starting\n";
Health -= 50;
cout << " - TakeDamage function complete\n";
}
int main(){
cout << "Main function starting\n";
TakeDamage();
cout << "We are back in main\n";
TakeDamage();
cout << "Main function complete\n";
}The result of running this program can be seen here:
Main function starting
- TakeDamage function starting
- TakeDamage function complete
We are back in main
- TakeDamage function starting
- TakeDamage function complete
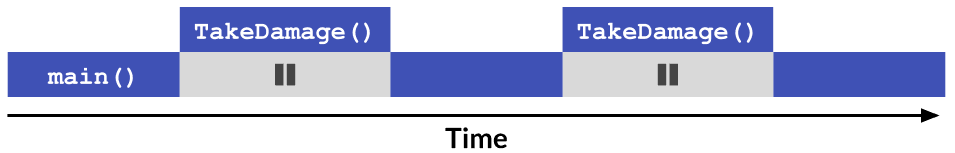
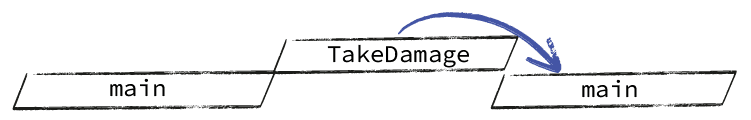
Main function completeThe following diagram illustrates the flow of this program through time.
What is the Call Stack?
Imagine running a program as building a tower, where each block is a function call. This tower is what we call the "call stack."
The Foundation: main Function
Every C++ program starts with the main function - it's like the base of our tower. The program ends when main finishes, much like how a tower can't stand without its base.
Adding Blocks: Function Calls
When main calls another function, like TakeDamage() in our example, think of it as pausing main to place a new block on top. This new block is TakeDamage(). Now, our tower has two blocks - main at the bottom, and TakeDamage() on top.
A Growing Tower: The Stack
Each time a function calls another, we add another block to our tower. The function on top is the one currently running. When it finishes, we remove its block, and the function below resumes execution where it left off.
Viewing the Call Stack in the Debugger
We first introduced the debugger in our previous chapter:
Introduction to Debugging
Creating a tiny program using numbers and booleans, then adding some breakpoints so we can step through our code in a debugger.
This lesson builds on that knowledge, showing how function calls and the call stack affect our debugging.
When debugging our program, most debuggers will include a user interface that shows us a snapshot of our call stack at the point our execution has paused. In Visual Studio, it looks like this:
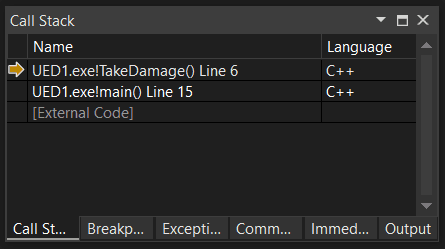
Here, we have paused execution by setting a breakpoint within our TakeDamage() function. We see that in our call stack at that point, external code (ie, the operating system) is at the bottom of the stack.
The operating system invoked our main function, so its stack frame is on top of the external code. And main invoked TakeDamage(), so its stack frame is on top of main.
The Call Stack and the Debugger
When debugging our earlier code, we had only one level of depth - everything was in the main function. There, we saw how we could advance execution line by line in the debugger using Step Over
Likely, you noticed that many different options appear when we start debugging. Many of those are to allow us to navigate the call stack created by our functions.
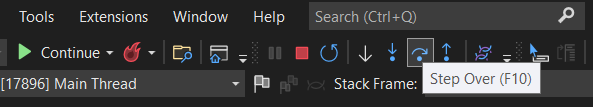
The three we want to talk about here are the different ways we can progress our application when debugging - Step Over, Step Into, Step Out.
Almost all debuggers support these actions, but they may have slightly different names within the respective user interfaces. In Visual Studio, these actions become available from the top menu when we're debugging a program:
Debugging Functions: Step Over
In our previous lesson, we saw that Step Over advances execution of our code, line by line. But what if the line we're about to execute is a function call?
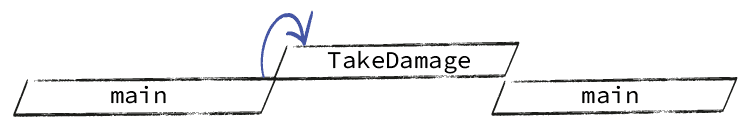
In that scenario, Step Over will run that function to completion behind the scenes. We won't see the inner workings of that function - we'll just see its effects once it is done.
In our example, if we're in the main function, and Step Over a line that calls TakeDamage(), the call to TakeDamage() will complete entirely. Once control shifts back to main, our debugger will pause execution again, and continue to let us step through main, line by line.

This is particularly useful when you want to focus on the flow of the function we're currently debugging, without getting sidetracked by the inner workings of every function it calls.
Debugging Functions: Step Into
When we're on a line of code that is about to call a function, we have the option to Step Into that function call.
Unlike Step Over, which skips over the details of a function call, Step Into takes you right into the heart of it. When you're on a line that's about to call a function, like when main is set to call TakeDamage(), using Step Into transports you directly to the first line of TakeDamage().
We could then move through the TakeDamage() function, line by line.
Debugging Functions: Step Out
After using Step Into to delve into a function like TakeDamage(), you might decide that you've seen enough and want to resume following the main flow of your program in main. This is where Step Out comes into play.
When you activate Step Out, the debugger completes the rest of the current function - in this case, TakeDamage() - without pausing. It essentially fast-forwards to the end of the function. Once TakeDamage() is fully executed, the debugger takes you back to the calling function, resuming right after where the function call was made.
In our example, you'd be brought back to main, right after the point where TakeDamage() was called.
Take some time to add a breakpoint to your code, and experiment with the debugger and how these options navigate around your code.
Establishing an understanding of the call stack concept in this simple program will greatly help us understand what is going on in bigger applications, and will be vital to help us debug them when things inevitably go wrong.
Test your Knowledge
Call Stack Debugging
When debugging, which action lets us enter a function that is about to be called?
Up next, we'll see how we can use booleans to make our functions more powerful and dynamic
Summary
In this lesson, we covered the main aspects of calling and debugging functions in C++. The key points are:
- The Call Stack: Function calls create a call stack, with
mainas the base. When functions end, they're removed from the stack. - Step Over: Advancing through code line by line, bypassing the internal details of function calls.
- Step Into: Entering specific function calls to inspect each step.
- Step Out: Exiting a function and returning to the calling function in the stack.
These tools and concepts are crucial for effective debugging and understanding the flow of C++ programs.
Conditional Logic
Use booleans and if statements to make our functions and programs more dynamic, choosing different execution paths.